How to use
Need to be guided on your journey?
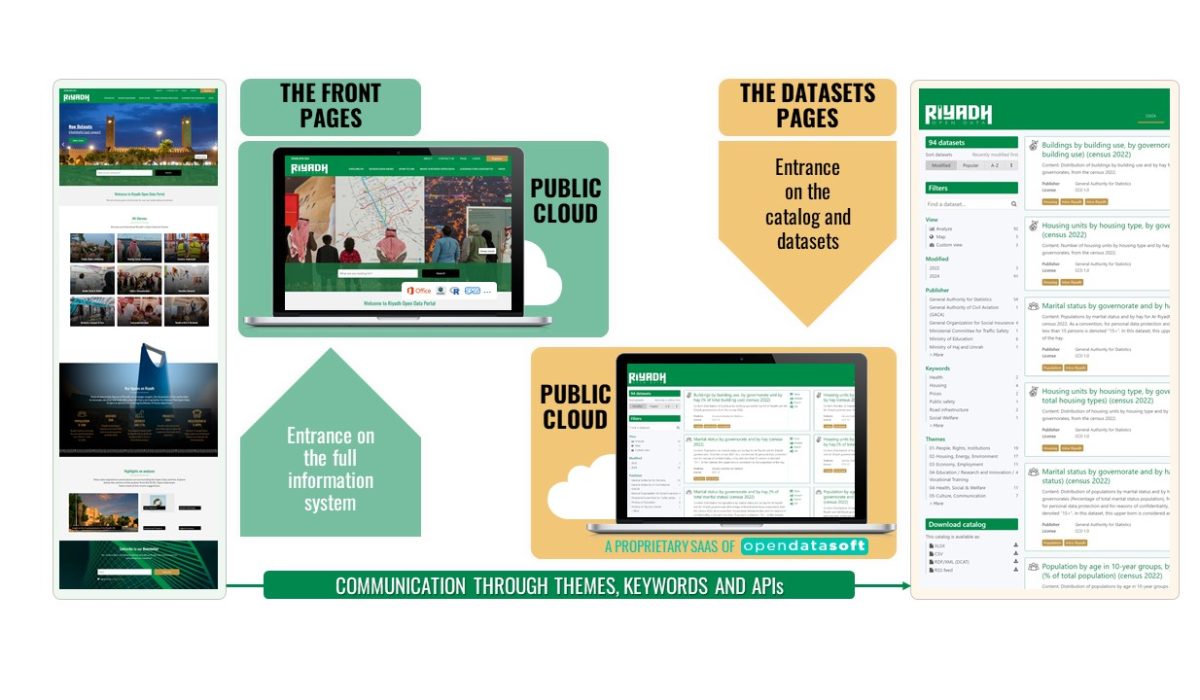
The Front Pages
Access Riyadh Data from the Front Pages (where you are now) and navigate through the multiple suggestions for landing on the information you are looking for:
- Discover the RCRC’s characterization of Riyadh data into themes for easier access to specific data.
- Read about the various uses for datasets through an RCRC article constructed around Riyadh Data.
- Find much more suggestions and learn how to use the Dataset Pages in the section below.
The Dataset Pages
Access the Dataset Pages right away at https://opendata.rcrc.gov.sa/
High level user guide
Access datasets
The Riyadh Data can be accessed from various sections of the Front Pages. Choose any of the entrance points listed below to easily and quickly find what you are looking for.
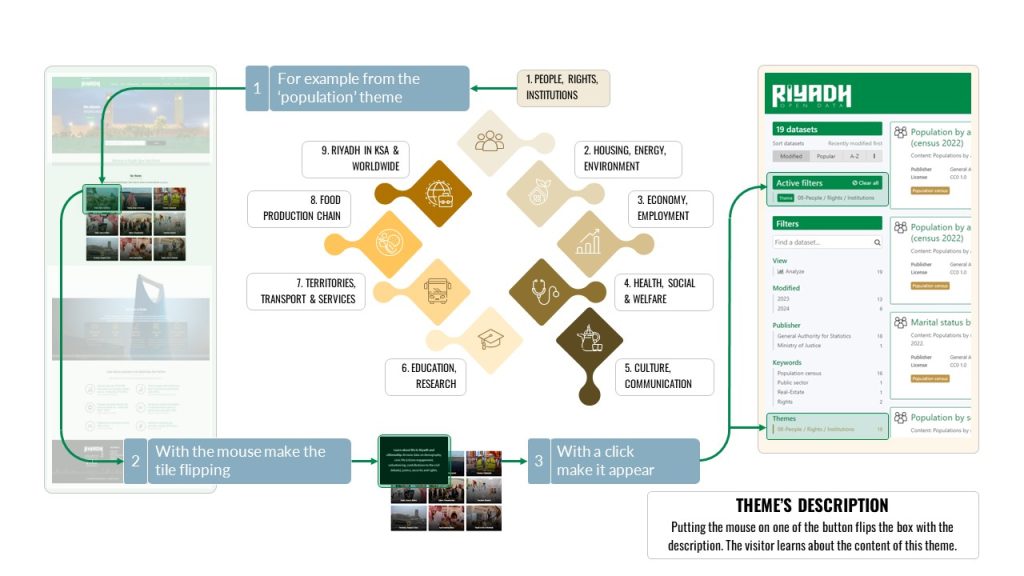
Access datasets through the ‘All themes‘ section at the beginning of the Homepage.
Learn about the content of each theme by pointing at them with the mouse.
Click on the theme of your choice to access the Catalog of datasets attached to it.
Access datasets by using the ‘Profiles‘ section from the ‘Explore by‘ page. Choose your profile. Are you a citizen, an entrepreneur, an investor, an environment-friendly person, an urbanist, a policymaker?
Click on the image that best suits you and access a profile-specific Catalog with a selection of datasets matching your interests.
Access datasets by geographical level from the ‘Explore by‘ page.
Choose the geographical level of interest to you. What are you looking for?
Data on:
- Intra-Riyadh, the inner boundaries of the city;
- Riyadh and its administrative region;
- Riyadh as part of the Kingdom;
- Riyadh as part of the world.
Click on the geographical area of your choice to be directed to the Catalog of datasets specific to it.
Access selection of the ‘Most popular‘ datasets from the ‘Explore by‘ page.
Click on the datasets that have been most visualized by visitors.
Access datasets by ‘Data Producer‘ from the ‘Explore by‘ page.
Click on the RCRC stakeholder of your choice to be directed to the Catalog of all datasets published by them.
Access the most recent datasets by going to the ‘Latest Datasets‘ section from the ‘Riyadh Data News‘ page.
Click on the latest datasets that have been published on the platform.
Access the full Riyadh Open Data Catalog (A-Z) from the bottom of this page.
Click on the ‘Go to Data Catalog (A-Z)’ button to access the entire Catalog sorted by alphabetical order.
Explore the Catalog
Access the Catalog of the Riyadh Open Data Portal from the Dataset Pages.
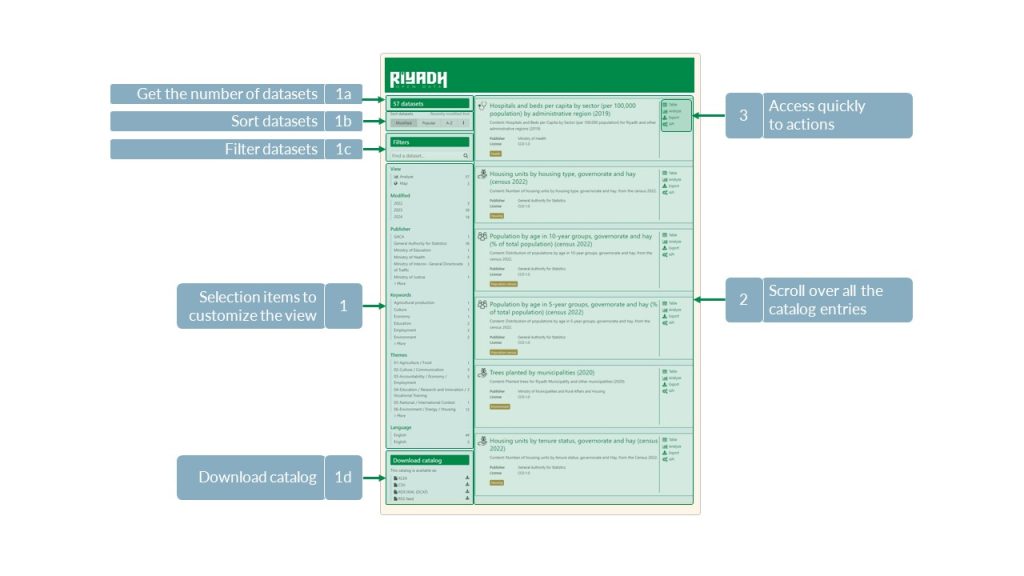
Browse the entire Catalog by sorting datasets by a choice of criteria (Tag#1b in image below) or by filtering content to target data of interest only (Tag#1c). The number of datasets (Tag#1a) that are accessible from the Catalog viewer (Tag#2) varies according to the active filter.
From the Catalog, access the datasets of your choice by clicking on their title or by selecting a specific view mode in the Quick Access menu (Tag#3). Data may be:
- Visualized on a table (from the Table tab);
- Visualized on a graph (Analyze tab);
- Directly exported as a daetaset that can be manipulated on your device (Export or API tabs).
Download the Catalog from thee ‘Download catalog’ section at the bottom left of the page (Tag#1d).
Visualize the dataset on tables
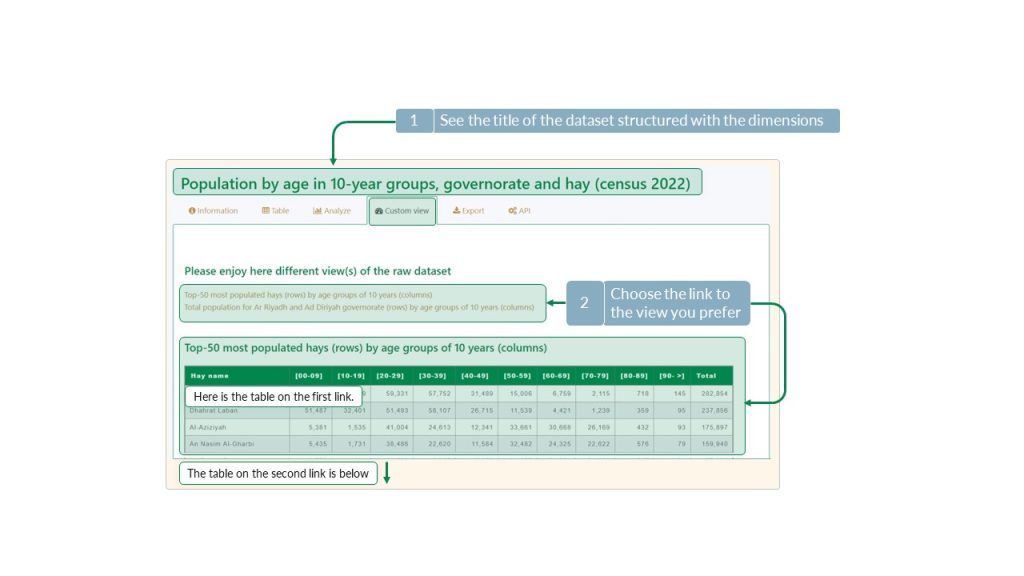
View data on tables from the ‘Table’ and/or the ‘Custom view’ tab (if activated) of the Dataset Page.
The ‘Table’ tab enables a technical view of the dataset (such as for PivotTables in Ms Excel). This dataset structure is most appropriate for downloading and working with the data directly. The ‘Custom view’ tab gives an economic view of the dataset to facilitate data reading.
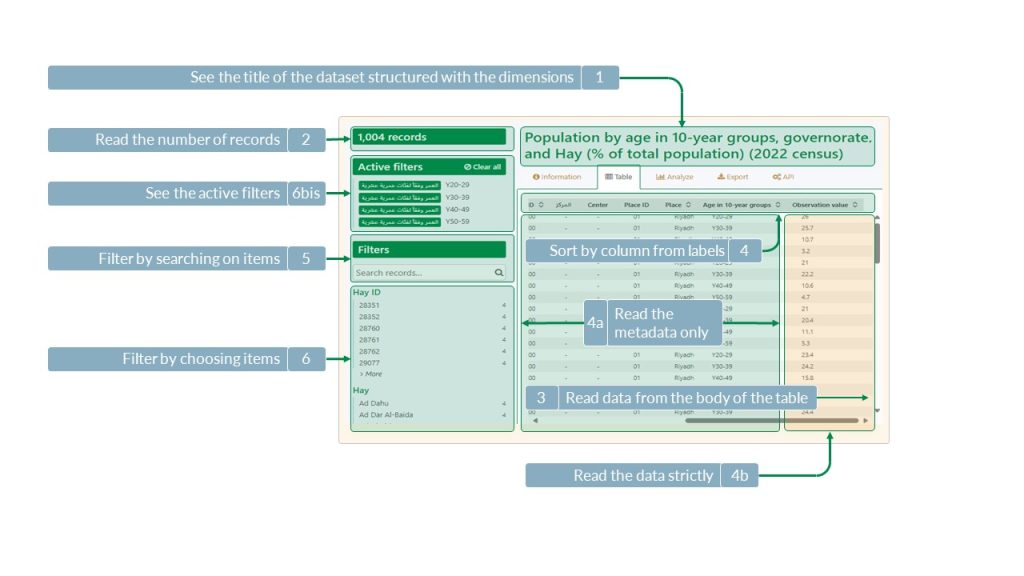
From the ‘Table’ tab, you will be able to access:
- The total number of records, which is visible on the left of the dataset’s title (Tag#2 of the image below);
- The dimensions and number of records for each dimension, which are located at the left of the table (Tag#6).
Filter the data by clicking on the items of the dimension. The items selected will show a darker line on their left side (Tag#6 bis) and appear in the active filters area below the number of records (Tag#2).
It is also possible to search for specific records by typing metadata associated with them in the search bar (Tag#5).
View multidimensional datasets in an easily readable table from the ‘Custom view’ tab. Scroll down to grasp the various economic views from a single dataset.
Visualize the dataset on a graph
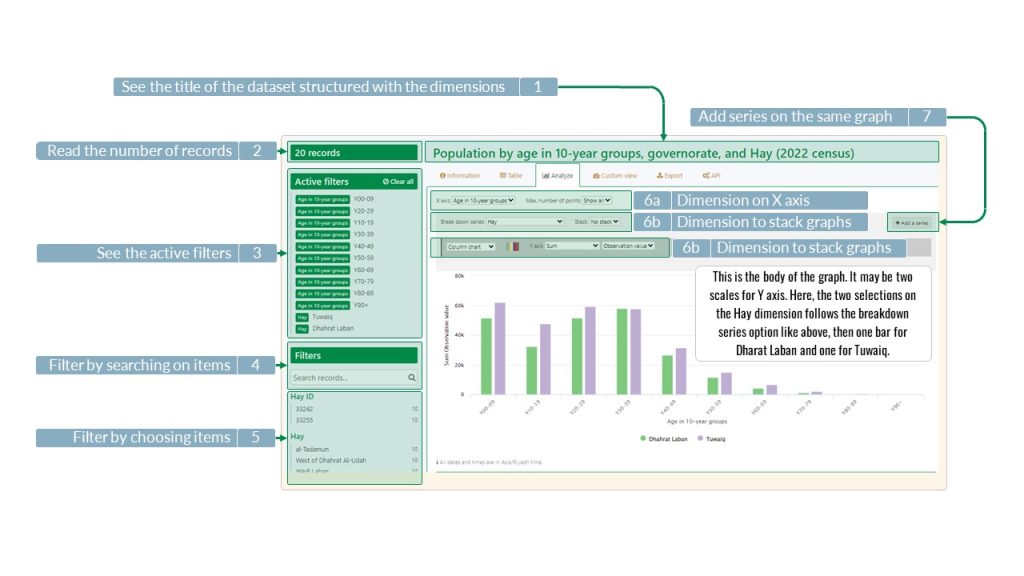
View data on a graph thanks to the ‘Analyze’ tab of the Dataset Pages:
- Select the data of interest in the filter area (Tag#1 in image below) (optional);
- Select the type of graph and a color palette (Tag#2);
- Select the variable attached to the ‘Y axis’ (Tag#3a). If the dataset is composed of more than one variable, adding another one is possible by clicking on ‘Add a series’ (Tag#3b);
- Select the metadata attached to the ‘X axis’ (Tag#4);
- Select the metadata of the data attached to the ‘Break down series’ (Tag#5).
Visualize the dataset in a map
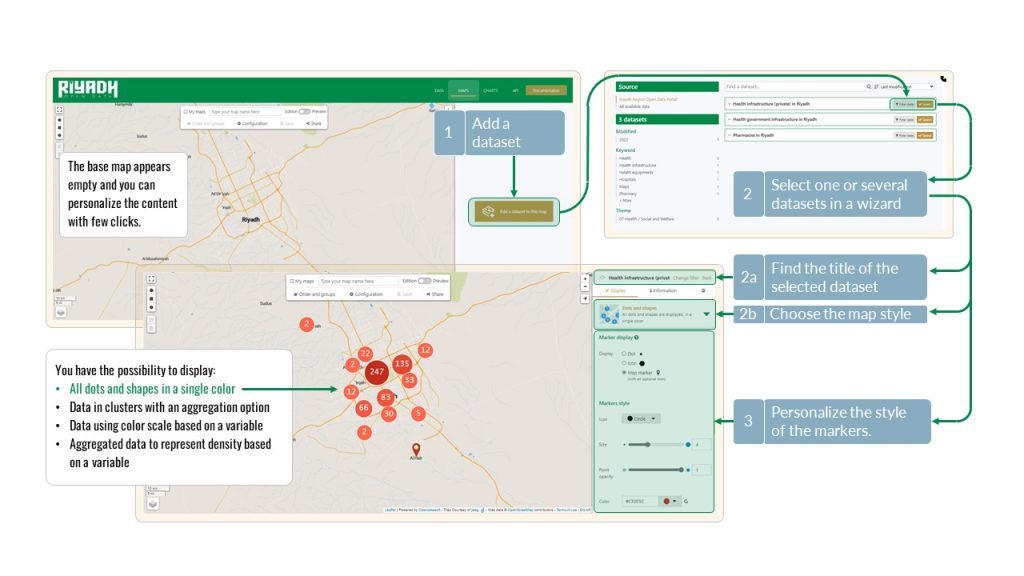
View datasets with geolocation data on a map either from the ‘Map’ tab of your Dataset page of choice or from the ‘MAPS’ page accessible through the main menu of the Dataset homepage.
From the ‘MAPS‘ page, create a map in three simple steps and combine several datasets on a single map.
- Click on ‘Add a dataset to this map’. A dialog window will open, showing a list of all datasets where a map option is available (Tag#1 in image below)
- Select one or several datasets (Tag#2)
- Use the end-user interactive map specifications (Tag#2b) by clicking on ‘Edit’ beside the selected dataset title. In the visibility section, choose your data and markers display options, shapers style and border, and zoom levels.
Download data
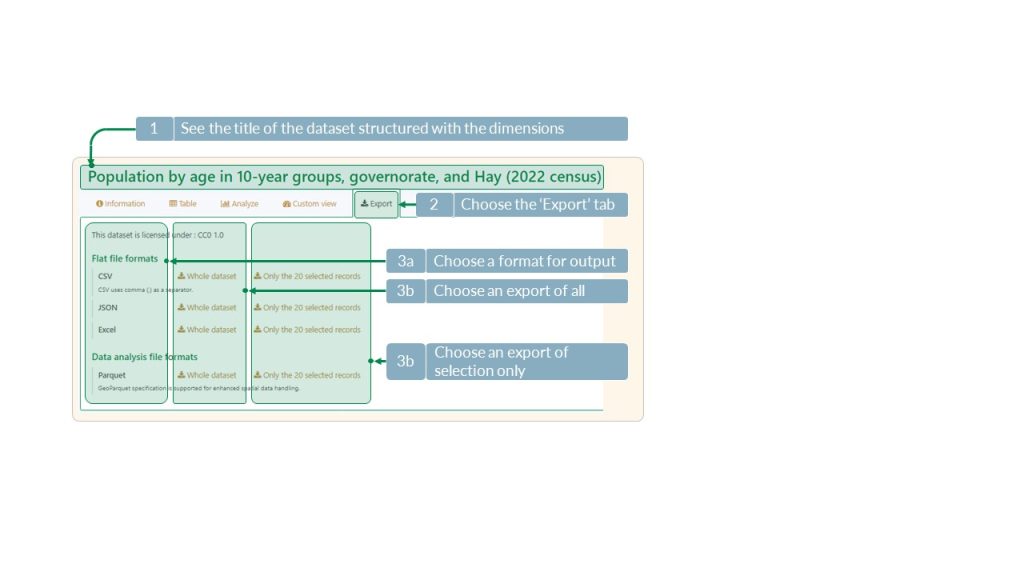
Download any dataset from the ‘Export‘ tab of the Dataset page.
You can download either the entire dataset or only the selected records listed in the active filters area (See section ‘Visualize the dataset on tables‘).
Download data using API
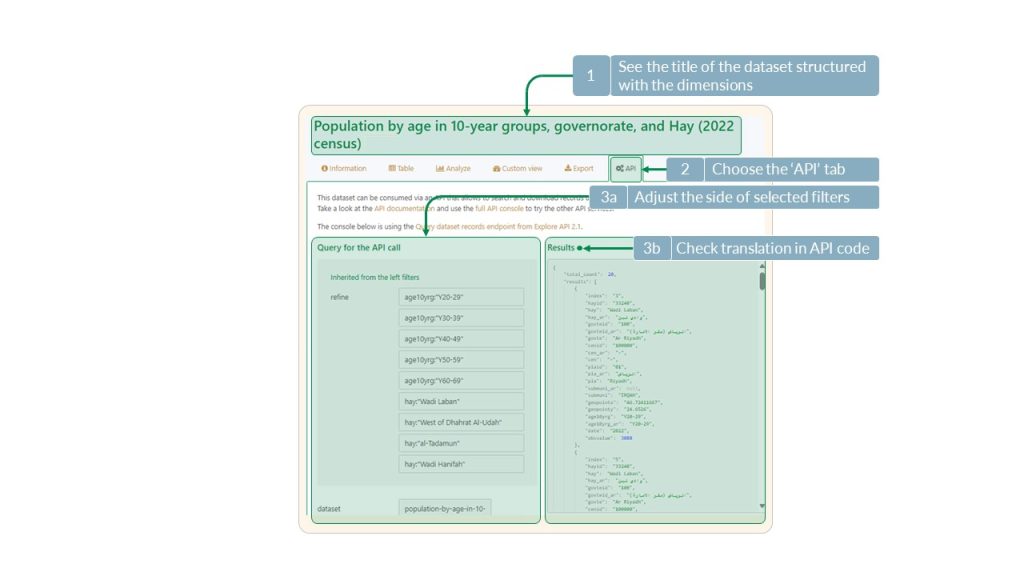
Automate the downloading process of Riyadh Data thanks to the ‘API‘ tab of the Dataset page.
It enables to automate the downloading of datasets through a user-friendly form for parameter specifications and a source code editor.
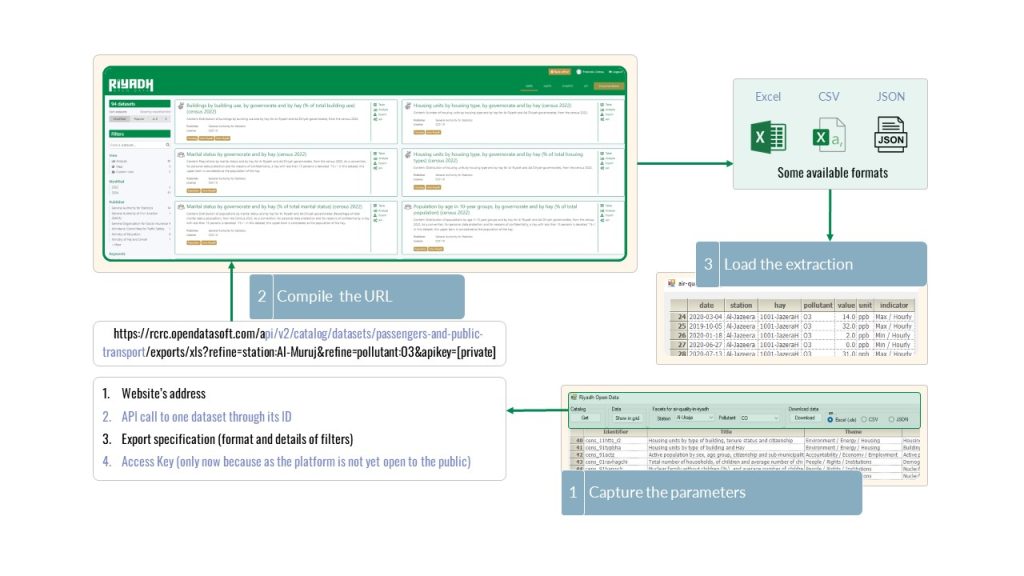
Data downloading using API requires 3 steps:
- Format a URL containing the request in the ODS specification (the ULR is formatted from the parameters captured by the application) (item 1 in image below);
- Send the formatted URL to the platform and collect the output in one of the available formats (item 2);
- Load the extraction inside the targeted application (item 3).
Go to data
Browse the entire Riyadh Open Data Catalog sorted by alphabetical order.


